Process Data Analytics

Editors


E-Mail Website
Collection Editor
Continuous Improvement Center of Excellence, The Dow Chemical Company, Lake Jackson, TX 77566, USA
Interests: process data analytics; machine learning; big data; visualization; process monitoring; Industry 4.0

E-Mail Website
Collection Editor
Massachusetts Institute of Technology, Cambridge, MA, USA

Topical Collection Information

Dear Colleagues,

Data analytics is a term used to describe a set of computational methods for the analysis of data to abstract knowledge and affect decision making. Typical information of interest includes (1) uncovering unknown patterns or correlations within the data; (2) constructing predictions of some variables as functions of other variables; (3) identifying data points that are atypical of the overall dataset; and (4) classifying different groups of outliers. The development of data analytics methods has seen rapid growth in the last decade, primarily by the machine learning and related communities that formulate answers to specific questions in terms of optimization problems.

This Special Issue concerns process data analytics, which refers to data analytics methods that are suitable for the types of data and problems that arise in manufacturing processes. The quantity of process data that has become available and stored in historical databases for manufacturing processes has grown by orders of magnitude, but the abstraction of the most value from this data has been elusive. The commonly used tools used in industrial practice have significant limitations in utility and performance, to such an extent that most data stored in historical databases are not analyzed at all rather than being analyzed poorly. Tools from machine learning and related communities typically require significant modifications to be effective for process data, and the structure of the available prior mechanistic information and other domain knowledge on processes and the types of questions that arise in manufacturing processes have a specificity that need to be taken into account to be able to develop the most effective data analytics methods.

This Special Issue, ”Process Data Analytics”, aims to bring together recent advances, and invites all original contributions, fundamental and applied, which can add to our understanding of the field. Topics may include, but are not limited to:

  • Process data analytics methods
  • Machine learning methods adapted for application to manufacturing processes
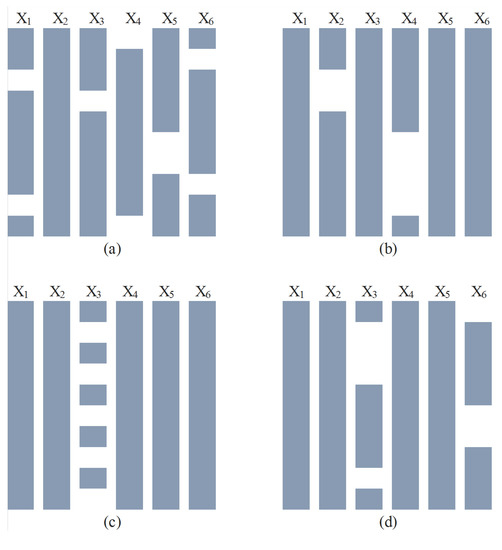
  • Methods for better handling of missing data
  • Fault detection and diagnosis
  • Adaptive process monitoring
  • Industrial case studies
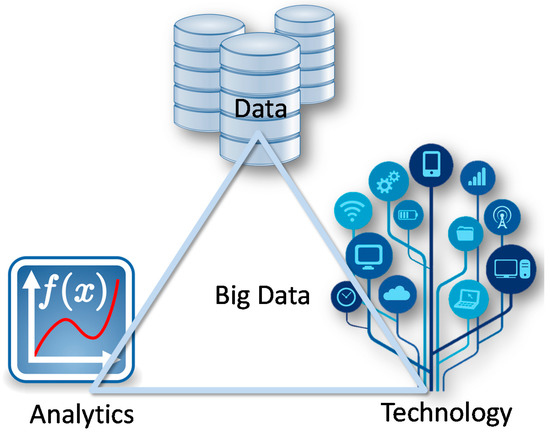
  • Applications to Big Data problems in manufacturing
  • Hybrid data analytics methods
  • Prognostic systems

Dr. Leo H. Chiang
Prof. Richard D. Braatz
Collection Editors

Manuscript Submission Information

Manuscripts should be submitted online at www.mdpi.com by registering and logging in to this website. Once you are registered, click here to go to the submission form. Manuscripts can be submitted until the deadline. All submissions that pass pre-check are peer-reviewed. Accepted papers will be published continuously in the journal (as soon as accepted) and will be listed together on the collection website. Research articles, review articles as well as short communications are invited. For planned papers, a title and short abstract (about 100 words) can be sent to the Editorial Office for announcement on this website.

Submitted manuscripts should not have been published previously, nor be under consideration for publication elsewhere (except conference proceedings papers). All manuscripts are thoroughly refereed through a single-blind peer-review process. A guide for authors and other relevant information for submission of manuscripts is available on the Instructions for Authors page. Processes is an international peer-reviewed open access monthly journal published by MDPI.

Please visit the Instructions for Authors page before submitting a manuscript. The Article Processing Charge (APC) for publication in this open access journal is 2400 CHF (Swiss Francs). Submitted papers should be well formatted and use good English. Authors may use MDPI's English editing service prior to publication or during author revisions.

Keywords

  • Data analytics
  • Process data analytics
  • Big data
  • Big data analytics
  • Machine learning
  • Diagnostic systems
  • Prognostics
  • Process monitoring
  • Process health monitoring
  • Fault detection and diagnosis
Published Papers (15 papers)

2023

Jump to: 2020, 2019, 2018, 2017

21 pages, 6230 KiB  
Article
Optimization Control Strategy for a Central Air Conditioning System Based on AFUCB-DQN
by He Tian, Mingwen Feng, Huaicong Fan, Ranran Cao and Qiang Gao
Processes 2023, 11(7), 2068; https://doi.org/10.3390/pr11072068 - 11 Jul 2023
Cited by 3 | Viewed by 2165
Abstract
The central air conditioning system accounts for 50% of the building energy consumption, and the cold source system accounts for more than 60% of the total energy consumption of the central air conditioning system. Therefore, it is crucial to solve the optimal control [...] Read more.
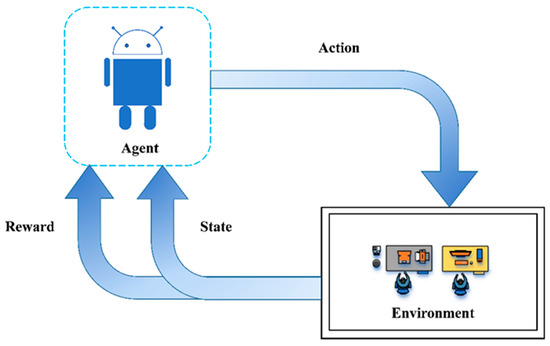
The central air conditioning system accounts for 50% of the building energy consumption, and the cold source system accounts for more than 60% of the total energy consumption of the central air conditioning system. Therefore, it is crucial to solve the optimal control strategy of the cold source system according to the cooling load demand, and adjust the operating parameters in time to achieve low energy consumption and high efficiency. Due to the complex and changeable characteristics of the central air conditioning system, it is often difficult to achieve ideal results using traditional control methods. In order to solve this problem, this study first coupled the building cooling load simulation environment and the cold source system simulation environment to build a central air conditioning system simulation environment. Secondly, noise interference was introduced to reduce the gap between the simulated environment and the actual environment, and improve the robustness of the environment. Finally, combined with deep reinforcement learning, an optimal control strategy for the central air conditioning system is proposed. Aiming at the simulation environment of the central air conditioning system, a new model-free algorithm is proposed, called the dominant function upper confidence bound deep Q-network (AFUCB-DQN). The algorithm combines the advantages of an advantage function and an upper confidence bound algorithm to balance the relationship between exploration and exploitation, so as to achieve a better control strategy search. Compared with the traditional deep Q-network (DQN) algorithm, double deep Q-network (DDQN) algorithm, and the distributed double deep Q-network (D3QN) algorithm, the AFUCB-DQN algorithm has more stable convergence, faster convergence speed, and higher reward. In this study, significant energy savings of 21.5%, 21.4%, and 22.3% were obtained by conducting experiments at indoor thermal comfort levels of 24 °C, 25 °C, and 26 °C in the summer. Full article
Show Figures

Figure 1

2020

Jump to: 2023, 2019, 2018, 2017

20 pages, 7444 KiB  
Article
Model Calibration of Stochastic Process and Computer Experiment for MVO Analysis of Multi-Low-Frequency Electromagnetic Data
by Muhammad Naeim Mohd Aris, Hanita Daud, Khairul Arifin Mohd Noh and Sarat Chandra Dass
Processes 2020, 8(5), 605; https://doi.org/10.3390/pr8050605 - 19 May 2020
Cited by 4 | Viewed by 3128
Abstract
An electromagnetic (EM) technique is employed in seabed logging (SBL) to detect offshore hydrocarbon-saturated reservoirs. In risk analysis for hydrocarbon exploration, computer simulation for subsurface modelling is a crucial task. It can be expensive and time-consuming due to its complicated mathematical equations, and [...] Read more.
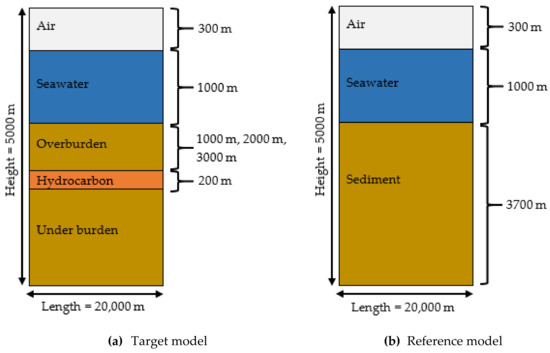
An electromagnetic (EM) technique is employed in seabed logging (SBL) to detect offshore hydrocarbon-saturated reservoirs. In risk analysis for hydrocarbon exploration, computer simulation for subsurface modelling is a crucial task. It can be expensive and time-consuming due to its complicated mathematical equations, and only a few realizations of input-output pairs can be generated after a very lengthy computational time. Understanding the unknown functions without any uncertainty measurement could be very challenging as well. We proposed model calibration between a stochastic process and computer experiment for magnitude versus offset (MVO) analysis. Two-dimensional (2D) Gaussian process (GP) models were developed for low-frequencies of 0.0625–0.5 Hz at different hydrocarbon depths to estimate EM responses at untried observations with less time consumption. The calculated error measurements revealed that the estimates were well-matched with the computer simulation technology (CST) outputs. Then, GP was fitted in the MVO plots to provide uncertainty quantification. Based on the confidence intervals, hydrocarbons were difficult to determine especially when their depth was 3000 m from the seabed. The normalized magnitudes for other frequencies also agreed with the resulting predictive variance. Thus, the model resolution for EM data decreases as the hydrocarbon depth increases even though multi-low frequencies were exercised in the SBL application. Full article
Show Figures

Figure 1

2019

Jump to: 2023, 2020, 2018, 2017

21 pages, 5258 KiB  
Article
Fault Identification Using Fast k-Nearest Neighbor Reconstruction
by Zhe Zhou, Zuxin Li, Zhiduan Cai and Peiliang Wang
Processes 2019, 7(6), 340; https://doi.org/10.3390/pr7060340 - 5 Jun 2019
Cited by 9 | Viewed by 3700
Abstract
Data with characteristics like nonlinear and non-Gaussian are common in industrial processes. As a non-parametric method, k-nearest neighbor (kNN) rule has shown its superiority in handling the data set with these complex characteristics. Once a fault is detected, to further identify the faulty [...] Read more.
Data with characteristics like nonlinear and non-Gaussian are common in industrial processes. As a non-parametric method, k-nearest neighbor (kNN) rule has shown its superiority in handling the data set with these complex characteristics. Once a fault is detected, to further identify the faulty variables is useful for finding the root cause and important for the process recovery. Without prior fault information, due to the increasing number of process variables, the existing kNN reconstruction-based identification methods need to exhaust all the combinations of variables, which is extremely time-consuming. Our previous work finds that the variable contribution by kNN (VCkNN), which defined in original variable space, can significantly reduce the ratio of false diagnosis. This reliable ranking of the variable contribution can be used to guide the variable selection in the identification procedure. In this paper, we propose a fast kNN reconstruction method by virtue of the ranking of VCkNN for multiple faulty variables identification. The proposed method significantly reduces the computation complexity of identification procedure while improves the missing reconstruction ratio. Experiments on a numerical case and Tennessee Eastman problem are used to demonstrate the performance of the proposed method. Full article
Show Figures

Figure 1

2018

Jump to: 2023, 2020, 2019, 2017

15 pages, 3566 KiB  
Article
Centrifugal Pump Monitoring and Determination of Pump Characteristic Curves Using Experimental and Analytical Solutions
by Marius Stan, Ion Pana, Mihail Minescu, Adonis Ichim and Catalin Teodoriu
Processes 2018, 6(2), 18; https://doi.org/10.3390/pr6020018 - 13 Feb 2018
Cited by 14 | Viewed by 13262
Abstract
Centrifugal pumps are widely used in the industry, especially in the oil and gas sector for fluids transport. Classically, these are designed to transfer single phase fluids (e.g., water) at high flow rates and relatively low pressures when compared with other pump types. [...] Read more.
Centrifugal pumps are widely used in the industry, especially in the oil and gas sector for fluids transport. Classically, these are designed to transfer single phase fluids (e.g., water) at high flow rates and relatively low pressures when compared with other pump types. As part of their constructive feature, centrifugal pumps rely on seals to prevent air entrapment into the rotor during its normal operation. Although this is a constructive feature, water should pass through the pump inlet even when the inlet manifold is damaged. Modern pumps are integrated in pumping units which consist of a drive (normally electric motor), a transmission (when needed), an electronic package (for monitoring and control), and the pump itself. The unit also has intake and outlet manifolds equipped with valves. Modern systems also include electronic components to measure and monitor pump working parameters such as pressure, temperature, etc. Equipment monitoring devices (vibration sensors, microphones) are installed on modern pumping units to help users evaluate the state of the machinery and detect deviations from the normal working condition. This paper addresses the influence of air-water two-phase mixture on the characteristic curve of a centrifugal pump; pump vibration in operation at various flow rates under these conditions; the possibilities of using the results of experimental investigations in the numerical simulations for design and training purposes, and the possibility of using vibration and sound analysis to detect changes in the equipment working condition. Conclusions show that vibration analysis provides accurate information about the pump’s functional state and the pumping process. Moreover, the acoustic emission also enables the evaluation of the pump status, but needs further improvements to better capture and isolate the usable sounds from the environment. Full article
Show Figures

Figure 1

19 pages, 7088 KiB  
Article
Predicting the Operating States of Grinding Circuits by Use of Recurrence Texture Analysis of Time Series Data
by Jason P. Bardinas, Chris Aldrich and Lara F. A. Napier
Processes 2018, 6(2), 17; https://doi.org/10.3390/pr6020017 - 11 Feb 2018
Cited by 12 | Viewed by 6192
Abstract
Grinding circuits typically contribute disproportionately to the overall cost of ore beneficiation and their optimal operation is therefore of critical importance in the cost-effective operation of mineral processing plants. This can be challenging, as these circuits can also exhibit complex, nonlinear behavior that [...] Read more.
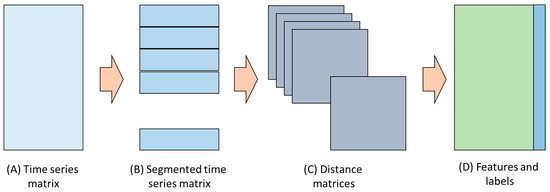
Grinding circuits typically contribute disproportionately to the overall cost of ore beneficiation and their optimal operation is therefore of critical importance in the cost-effective operation of mineral processing plants. This can be challenging, as these circuits can also exhibit complex, nonlinear behavior that can be difficult to model. In this paper, it is shown that key time series variables of grinding circuits can be recast into sets of descriptor variables that can be used in advanced modelling and control of the mill. Two real-world case studies are considered. In the first, it is shown that the controller states of an autogenous mill can be identified from the load measurements of the mill by using a support vector machine and the abovementioned descriptor variables as predictors. In the second case study, it is shown that power and temperature measurements in a horizontally stirred mill can be used for online estimation of the particle size of the mill product. Full article
Show Figures

Figure 1

21 pages, 1759 KiB  
Article
A Throughput Management System for Semiconductor Wafer Fabrication Facilities: Design, Systems and Implementation
by Liam Y. Hsieh and Tsung-Ju Hsieh
Processes 2018, 6(2), 16; https://doi.org/10.3390/pr6020016 - 11 Feb 2018
Cited by 12 | Viewed by 20368
Abstract
Equipment throughput is one of the most critical parameters for production planning and scheduling, which is often derived by optimization techniques to achieve business goals. However, in semiconductor manufacturing, up-to-date and reliable equipment throughput is not easy to estimate and maintain because of [...] Read more.
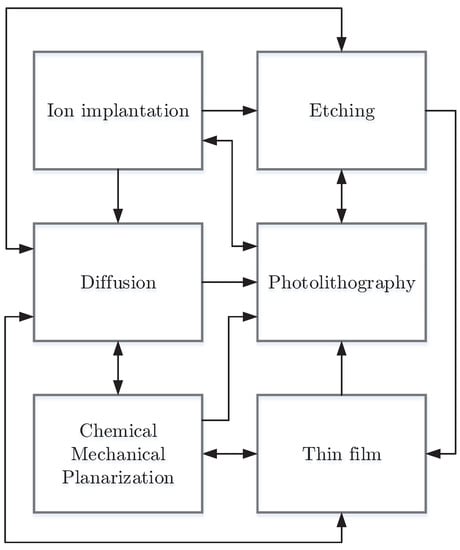
Equipment throughput is one of the most critical parameters for production planning and scheduling, which is often derived by optimization techniques to achieve business goals. However, in semiconductor manufacturing, up-to-date and reliable equipment throughput is not easy to estimate and maintain because of the high complexity and extreme amount of data in the production systems. This article concerns the development and implementation of a throughput management system tailored for a semiconductor wafer fabrication plant (Fab). A brief overview of the semiconductor manufacturing and an introduction of the case Fab are presented first. Then, we focus on the system architecture and some concepts of crucial modules. This study also describes the project timescales and difficulties and discusses both tangible and intangible benefits from this project. Full article
Show Figures

Figure 1

2017

Jump to: 2023, 2020, 2019, 2018

6211 KiB  
Article
RadViz Deluxe: An Attribute-Aware Display for Multivariate Data
by Shenghui Cheng, Wei Xu and Klaus Mueller
Processes 2017, 5(4), 75; https://doi.org/10.3390/pr5040075 - 22 Nov 2017
Cited by 18 | Viewed by 8030
Abstract
Modern data, such as occurring in chemical engineering, typically entail large collections of samples with numerous dimensional components (or attributes). Visualizing the samples in relation of these components can bring valuable insight. For example, one may be able to see how a [...] Read more.
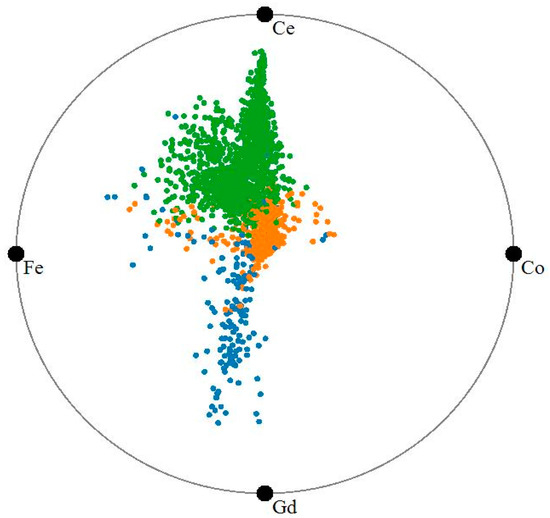
Modern data, such as occurring in chemical engineering, typically entail large collections of samples with numerous dimensional components (or attributes). Visualizing the samples in relation of these components can bring valuable insight. For example, one may be able to see how a certain chemical property is expressed in the samples taken. This could reveal if there are clusters and outliers that have specific distinguishing properties. Current multivariate visualization methods lack the ability to reveal these types of information at a sufficient degree of fidelity since they are not optimized to simultaneously present the relations of the samples as well as the relations of the samples to their attributes. We propose a display that is designed to reveal these multiple relations. Our scheme is based on the concept of RadViz, but enhances the layout with three stages of iterative refinement. These refinements reduce the layout error in terms of three essential relationships—sample to sample, attribute to attribute, and sample to attribute. We demonstrate the effectiveness of our method via various real-world domain examples in the domain of chemical process engineering. In addition, we also formally derive the equivalence of RadViz to a popular multivariate interpolation method called generalized barycentric coordinates. Full article
Show Figures

Figure 1

1582 KiB  
Article
How to Generate Economic and Sustainability Reports from Big Data? Qualifications of Process Industry
by Esa Hämäläinen and Tommi Inkinen
Processes 2017, 5(4), 64; https://doi.org/10.3390/pr5040064 - 1 Nov 2017
Cited by 11 | Viewed by 7109
Abstract
Big Data may introduce new opportunities, and for this reason it has become a mantra among most industries. This paper focuses on examining how to develop cost and sustainable reporting by utilizing Big Data that covers economic values, production volumes, and emission information. [...] Read more.
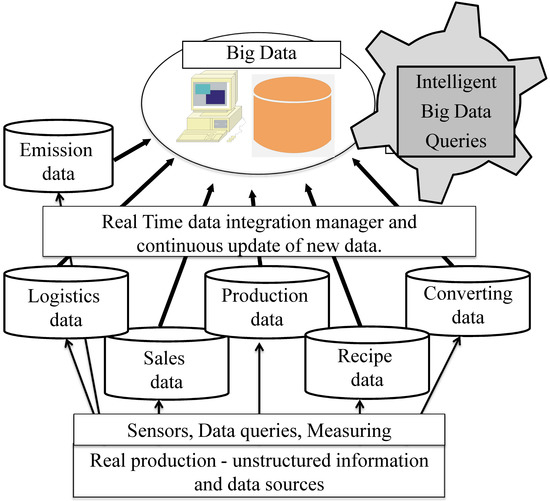
Big Data may introduce new opportunities, and for this reason it has become a mantra among most industries. This paper focuses on examining how to develop cost and sustainable reporting by utilizing Big Data that covers economic values, production volumes, and emission information. We assume strongly that this use supports cleaner production, while at the same time offers more information for revenue and profitability development. We argue that Big Data brings company-wide business benefits if data queries and interfaces are built to be interactive, intuitive, and user-friendly. The amount of information related to operations, costs, emissions, and the supply chain would increase enormously if Big Data was used in various manufacturing industries. It is essential to expose the relevant correlations between different attributes and data fields. Proper algorithm design and programming are key to making the most of Big Data. This paper introduces ideas on how to refine raw data into valuable information, which can serve many types of end users, decision makers, and even external auditors. Concrete examples are given through an industrial paper mill case, which covers environmental aspects, cost-efficiency management, and process design. Full article
Show Figures

Figure 1

1647 KiB  
Article
A Long-Short Term Memory Recurrent Neural Network Based Reinforcement Learning Controller for Office Heating Ventilation and Air Conditioning Systems
by Yuan Wang, Kirubakaran Velswamy and Biao Huang
Processes 2017, 5(3), 46; https://doi.org/10.3390/pr5030046 - 18 Aug 2017
Cited by 113 | Viewed by 14484
Abstract
Energy optimization in buildings by controlling the Heating Ventilation and Air Conditioning (HVAC) system is being researched extensively. In this paper, a model-free actor-critic Reinforcement Learning (RL) controller is designed using a variant of artificial recurrent neural networks called Long-Short-Term Memory (LSTM) networks. [...] Read more.
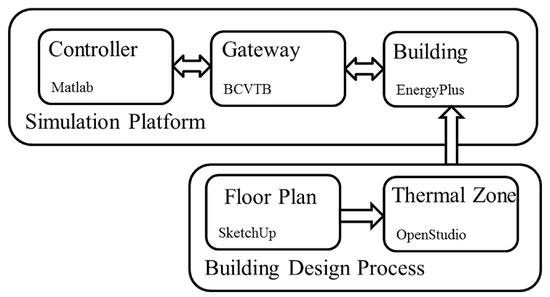
Energy optimization in buildings by controlling the Heating Ventilation and Air Conditioning (HVAC) system is being researched extensively. In this paper, a model-free actor-critic Reinforcement Learning (RL) controller is designed using a variant of artificial recurrent neural networks called Long-Short-Term Memory (LSTM) networks. Optimization of thermal comfort alongside energy consumption is the goal in tuning this RL controller. The test platform, our office space, is designed using SketchUp. Using OpenStudio, the HVAC system is installed in the office. The control schemes (ideal thermal comfort, a traditional control and the RL control) are implemented in MATLAB. Using the Building Control Virtual Test Bed (BCVTB), the control of the thermostat schedule during each sample time is implemented for the office in EnergyPlus alongside local weather data. Results from training and validation indicate that the RL controller improves thermal comfort by an average of 15% and energy efficiency by an average of 2.5% as compared to other strategies mentioned. Full article
Show Figures

Figure 1

593 KiB  
Article
Data Visualization and Visualization-Based Fault Detection for Chemical Processes
by Ray C. Wang, Michael Baldea and Thomas F. Edgar
Processes 2017, 5(3), 45; https://doi.org/10.3390/pr5030045 - 14 Aug 2017
Cited by 6 | Viewed by 7635
Abstract
Over the years, there has been a consistent increase in the amount of data collected by systems and processes in many different industries and fields. Simultaneously, there is a growing push towards revealing and exploiting of the information contained therein. The chemical processes [...] Read more.
Over the years, there has been a consistent increase in the amount of data collected by systems and processes in many different industries and fields. Simultaneously, there is a growing push towards revealing and exploiting of the information contained therein. The chemical processes industry is one such field, with high volume and high-dimensional time series data. In this paper, we present a unified overview of the application of recently-developed data visualization concepts to fault detection in the chemical industry. We consider three common types of processes and compare visualization-based fault detection performance to methods used currently. Full article
Show Figures

Figure 1

5016 KiB  
Review
Design of Experiments for Control-Relevant Multivariable Model Identification: An Overview of Some Basic Recent Developments
by Shobhit Misra, Mark Darby, Shyam Panjwani and Michael Nikolaou
Processes 2017, 5(3), 42; https://doi.org/10.3390/pr5030042 - 3 Aug 2017
Cited by 4 | Viewed by 6073
Abstract
The effectiveness of model-based multivariable controllers depends on the quality of the model used. In addition to satisfying standard accuracy requirements for model structure and parameter estimates, a model to be used in a controller must also satisfy control-relevant requirements, such as integral [...] Read more.
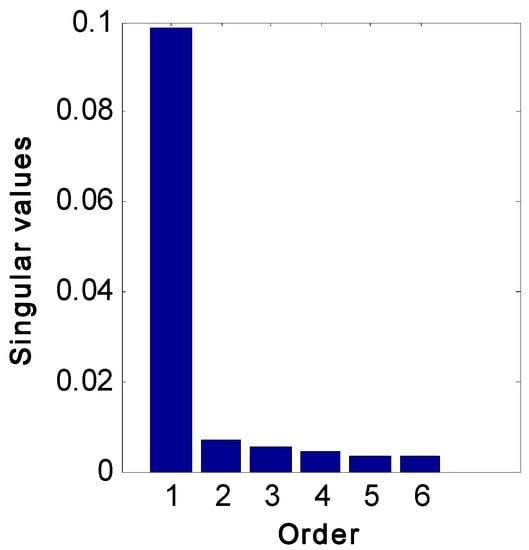
The effectiveness of model-based multivariable controllers depends on the quality of the model used. In addition to satisfying standard accuracy requirements for model structure and parameter estimates, a model to be used in a controller must also satisfy control-relevant requirements, such as integral controllability. Design of experiments (DOE), which produce data from which control-relevant models can be accurately estimated, may differ from standard DOE. The purpose of this paper is to emphasize this basic principle and to summarize some fundamental results obtained in recent years for DOE in two important cases: Accurate estimation of the order of a multivariable model and efficient identification of a model that satisfies integral controllability; both important for the design of robust model-based controllers. For both cases, we provide an overview of recent results that can be easily incorporated by the final user in related DOE. Computer simulations illustrate outcomes to be anticipated. Finally, opportunities for further development are discussed. Full article
Show Figures

Figure 1

4390 KiB  
Article
Big Data Analytics for Smart Manufacturing: Case Studies in Semiconductor Manufacturing
by James Moyne and Jimmy Iskandar
Processes 2017, 5(3), 39; https://doi.org/10.3390/pr5030039 - 12 Jul 2017
Cited by 200 | Viewed by 40472
Abstract
Smart manufacturing (SM) is a term generally applied to the improvement in manufacturing operations through integration of systems, linking of physical and cyber capabilities, and taking advantage of information including leveraging the big data evolution. SM adoption has been occurring unevenly across industries, [...] Read more.
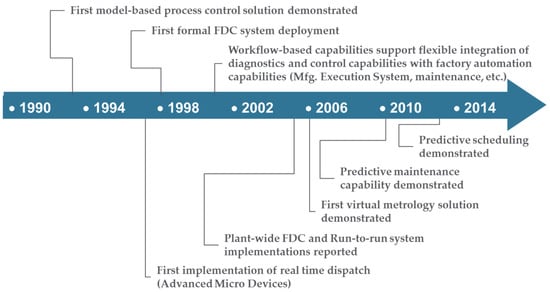
Smart manufacturing (SM) is a term generally applied to the improvement in manufacturing operations through integration of systems, linking of physical and cyber capabilities, and taking advantage of information including leveraging the big data evolution. SM adoption has been occurring unevenly across industries, thus there is an opportunity to look to other industries to determine solution and roadmap paths for industries such as biochemistry or biology. The big data evolution affords an opportunity for managing significantly larger amounts of information and acting on it with analytics for improved diagnostics and prognostics. The analytics approaches can be defined in terms of dimensions to understand their requirements and capabilities, and to determine technology gaps. The semiconductor manufacturing industry has been taking advantage of the big data and analytics evolution by improving existing capabilities such as fault detection, and supporting new capabilities such as predictive maintenance. For most of these capabilities: (1) data quality is the most important big data factor in delivering high quality solutions; and (2) incorporating subject matter expertise in analytics is often required for realizing effective on-line manufacturing solutions. In the future, an improved big data environment incorporating smart manufacturing concepts such as digital twin will further enable analytics; however, it is anticipated that the need for incorporating subject matter expertise in solution design will remain. Full article
Show Figures

Figure 1

924 KiB  
Article
Principal Component Analysis of Process Datasets with Missing Values
by Kristen A. Severson, Mark C. Molaro and Richard D. Braatz
Processes 2017, 5(3), 38; https://doi.org/10.3390/pr5030038 - 6 Jul 2017
Cited by 39 | Viewed by 12222
Abstract
Datasets with missing values arising from causes such as sensor failure, inconsistent sampling rates, and merging data from different systems are common in the process industry. Methods for handling missing data typically operate during data pre-processing, but can also occur during model building. [...] Read more.
Datasets with missing values arising from causes such as sensor failure, inconsistent sampling rates, and merging data from different systems are common in the process industry. Methods for handling missing data typically operate during data pre-processing, but can also occur during model building. This article considers missing data within the context of principal component analysis (PCA), which is a method originally developed for complete data that has widespread industrial application in multivariate statistical process control. Due to the prevalence of missing data and the success of PCA for handling complete data, several PCA algorithms that can act on incomplete data have been proposed. Here, algorithms for applying PCA to datasets with missing values are reviewed. A case study is presented to demonstrate the performance of the algorithms and suggestions are made with respect to choosing which algorithm is most appropriate for particular settings. An alternating algorithm based on the singular value decomposition achieved the best results in the majority of test cases involving process datasets. Full article
Show Figures

Figure 1

773 KiB  
Article
Industrial Process Monitoring in the Big Data/Industry 4.0 Era: from Detection, to Diagnosis, to Prognosis
by Marco S. Reis and Geert Gins
Processes 2017, 5(3), 35; https://doi.org/10.3390/pr5030035 - 30 Jun 2017
Cited by 227 | Viewed by 22223
Abstract
We provide a critical outlook of the evolution of Industrial Process Monitoring (IPM) since its introduction almost 100 years ago. Several evolution trends that have been structuring IPM developments over this extended period of time are briefly referred, with more focus on data-driven [...] Read more.
We provide a critical outlook of the evolution of Industrial Process Monitoring (IPM) since its introduction almost 100 years ago. Several evolution trends that have been structuring IPM developments over this extended period of time are briefly referred, with more focus on data-driven approaches. We also argue that, besides such trends, the research focus has also evolved. The initial period was centred on optimizing IPM detection performance. More recently, root cause analysis and diagnosis gained importance and a variety of approaches were proposed to expand IPM with this new and important monitoring dimension. We believe that, in the future, the emphasis will be to bring yet another dimension to IPM: prognosis. Some perspectives are put forward in this regard, including the strong interplay of the Process and Maintenance departments, hitherto managed as separated silos. Full article
Show Figures

Figure 1

862 KiB  
Article
Outlier Detection in Dynamic Systems with Multiple Operating Points and Application to Improve Industrial Flare Monitoring
by Shu Xu, Bo Lu, Noel Bell and Mark Nixon
Processes 2017, 5(2), 28; https://doi.org/10.3390/pr5020028 - 31 May 2017
Cited by 8 | Viewed by 9004
Abstract
In chemical industries, process operations are usually comprised of several discrete operating regions with distributions that drift over time. These complexities complicate outlier detection in the presence of intrinsic process dynamics. In this article, we consider the problem of detecting univariate outliers in [...] Read more.
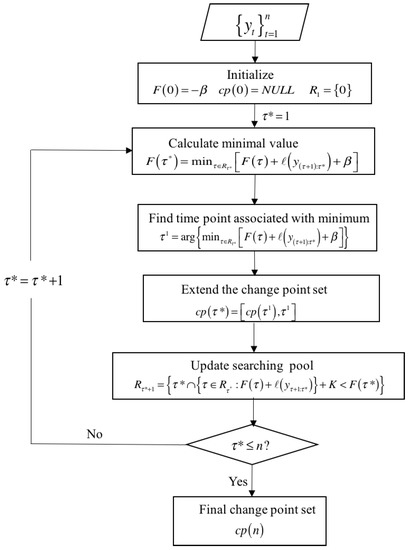
In chemical industries, process operations are usually comprised of several discrete operating regions with distributions that drift over time. These complexities complicate outlier detection in the presence of intrinsic process dynamics. In this article, we consider the problem of detecting univariate outliers in dynamic systems with multiple operating points. A novel method combining the time series Kalman filter (TSKF) with the pruned exact linear time (PELT) approach to detect outliers is proposed. The proposed method outperformed benchmark methods in outlier removal performance using simulated data sets of dynamic systems with mean shifts. The method was also able to maintain the integrity of the original data set after performing outlier removal. In addition, the methodology was tested on industrial flaring data to pre-process the flare data for discriminant analysis. The industrial test case shows that performing outlier removal dramatically improves flare monitoring results through Partial Least Squares Discriminant Analysis (PLS-DA), which further confirms the importance of data cleaning in process data analytics. Full article
Show Figures

Figure 1

Back to TopTop