Next Issue
Volume 12, April
Previous Issue
Volume 12, February


Atmosphere, Volume 12, Issue 3 (March 2021) – 124 articles

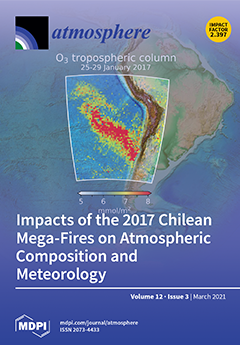
Cover Story (view full-size image): Historic wildfires were recorded in Central Chile in the summer of 2017. From these records, satellite data and modeling revealed a massive plume, which affected atmospheric composition, meteorology and cloud cover over 2000 km and as high as 7 km altitude. The air quality in Santiago dramatically worsened across several consecutive days. Large amounts of pollutants were deposited over land and the ocean, having a wide range of possible environmental consequences. Fire-generated aerosols significantly thickened the clouds over the Pacific Ocean and decreased surface radiation over land, which has led to cooler temperatures and a shallower mixing layer. These implications are paramount for the future regional climate as events of this magnitude might begin to occur more frequently. View this paper
  • Issues are regarded as officially published after their release is announced to the table of contents alert mailing list.
  • You may sign up for e-mail alerts to receive table of contents of newly released issues.
  • PDF is the official format for papers published in both, html and pdf forms. To view the papers in pdf format, click on the "PDF Full-text" link, and use the free Adobe Reader to open them.
Order results
Result details
Section
Select all
Export citation of selected articles as:
18 pages, 24199 KiB  
Article
Trends in Different Grades of Precipitation over the Yangtze River Basin from 1960 to 2017
by Mulan Hu, Manyu Dong, Xiangyou Tian, Leixin Wang and Yuan Jiang
Atmosphere 2021, 12(3), 413; https://doi.org/10.3390/atmos12030413 - 23 Mar 2021
Cited by 14 | Viewed by 2916
Abstract
Under the background of global warming, the trends and variabilities of different grades of precipitation have significant effects on the management of regional ecosystems and water resources. Based on a daily precipitation dataset collected from 148 meteorological stations in the Yangtze River Basin [...] Read more.
Under the background of global warming, the trends and variabilities of different grades of precipitation have significant effects on the management of regional ecosystems and water resources. Based on a daily precipitation dataset collected from 148 meteorological stations in the Yangtze River Basin from 1960 to 2017, precipitation events were divided into four grades (small, moderate, large, and heavy precipitation events) according to the precipitation intensity to analyze the temporal and spatial change trends of different grades of precipitation amounts and frequencies, and the influence of different grades of precipitation on total precipitation was also discussed in this study. The results revealed that small precipitation amounts over the Yangtze River Basin decreased significantly, with a rate of −1.22%/10a, while heavy precipitation amounts showed a significant increasing trend (4.27%/10a) during the study period. The precipitation frequency of small and total events decreased significantly, with rates of −3.86%/10a and −2.97%/10a, respectively. Regionally, from the upper reaches to the lower reaches of the Yangtze River Basin, the contribution rate of small precipitation amounts and frequencies to the total precipitation gradually decreased, while heavy precipitation amounts and frequencies increased. The different grades of precipitation in region II showed a decreasing trend due to its unique geographical features. Furthermore, a Pearson correlation analysis was used to analyze the response of precipitation to long-term air temperature, demonstrating that small and moderate precipitation amounts and frequencies were mainly negatively correlated with long-term air temperature and that heavy precipitation amounts showed a stronger positive correlation with long-term air temperature (13.35%/K). Based on this, the rate of change in heavy precipitation in the Yangtze River Basin may be higher under the background of climate warming, which will lead to greater risks of extreme floods in the future. Evaluating and predicting the trends of different grades can provide a theoretical reference for agricultural production, flood control, and drought mitigation. Full article
(This article belongs to the Section Climatology)
Show Figures

Figure 1

26 pages, 9565 KiB  
Article
Airborne Testing of 2-μm Pulsed IPDA Lidar for Active Remote Sensing of Atmospheric Carbon Dioxide
by Tamer F. Refaat, Mulugeta Petros, Charles W. Antill, Upendra N. Singh, Yonghoon Choi, James V. Plant, Joshua P. Digangi and Anna Noe
Atmosphere 2021, 12(3), 412; https://doi.org/10.3390/atmos12030412 - 23 Mar 2021
Cited by 18 | Viewed by 3179
Abstract
The capability of an airborne 2-μm integrated path differential absorption (IPDA) lidar for high-accuracy and high-precision active remote sensing of weighted-average column dry-air volume mixing ratio of atmospheric carbon dioxide (XCO2) is demonstrated. A test flight was conducted over the costal [...] Read more.
The capability of an airborne 2-μm integrated path differential absorption (IPDA) lidar for high-accuracy and high-precision active remote sensing of weighted-average column dry-air volume mixing ratio of atmospheric carbon dioxide (XCO2) is demonstrated. A test flight was conducted over the costal oceanic region of the USA to assess instrument performance during severe weather. The IPDA targets CO2 R30 absorption line using high-energy 2-μm laser transmitter. HgCdTe avalanche photodiode detection system is used in the receiver. Updated instrument model included range correction factor to account for platform attitude. Error budget for XCO2 retrieval predicts lower random error for longer sensing column length. Systematic error is dominated by water vapor (H2O) through dry-air number density derivation, followed by H2O interference and ranging related uncertainties. IPDA XCO2 retrieval results in 404.43 ± 1.23 ppm, as compared to 405.49 ± 0.01 ppm from prediction models, using consistent reflectivity and steady elevation oceanic surface target. This translates to 0.26% and 0.30% relative accuracy and precision, respectively. During gradual spiral descend, IPDA results in 404.89 ± 1.19 ppm as compared model of 404.75 ± 0.73 ppm indicating 0.04% and 0.23% relative accuracy, respectively. Challenging cloud targets limited retrieval accuracy and precision to 2.56% and 4.78%, respectively, due to H2O and ranging errors. Full article
(This article belongs to the Special Issue Remote Sensing of Atmospheric Carbon Dioxide)
Show Figures

Figure 1

23 pages, 4332 KiB  
Article
Development of the Global to Mesoscale Air Quality Forecast and Analysis System (GMAF) and Its Application to PM2.5 Forecast in Korea
by SeogYeon Cho, HyeonYeong Park, JeongSeok Son and LimSeok Chang
Atmosphere 2021, 12(3), 411; https://doi.org/10.3390/atmos12030411 - 23 Mar 2021
Cited by 11 | Viewed by 3125
Abstract
This paper presents the development of the global to mesoscale air quality forecast and analysis system (GMAF) and its application to particulate matter under 2.5 μm (PM2.5) forecast in Korea. The GMAF combined a mesoscale model with a global data assimilation [...] Read more.
This paper presents the development of the global to mesoscale air quality forecast and analysis system (GMAF) and its application to particulate matter under 2.5 μm (PM2.5) forecast in Korea. The GMAF combined a mesoscale model with a global data assimilation system by the grid nudging based four-dimensional data assimilation (FDDA). The grid nudging based FDDA developed for weather forecast and analysis was extended to air quality forecast and analysis for the first time as an alternative to data assimilation of surface monitoring data. The below cloud scavenging module and the secondary organic formation module of the community multiscale air quality model (CMAQ) were modified and subsequently verified by comparing with the PM speciation observation from the PM supersite. The observation data collected from the criteria air pollutant monitoring networks in Korea were used to evaluate forecast performance of GMAF for the year of 2016. The GMAF showed good performance in forecasting the daily mean PM2.5 concentrations at Seoul; the correlation coefficient between the observed and forecasted PM2.5 concentrations was 0.78; the normalized mean error was 25%; the probability of detection for the events exceeding the national PM2.5 standard was 0.81 whereas the false alarm rate was only 0.38. Both the hybrid bias correction technique and the Kalman filter bias adjustment technique were implemented into the GMAF as postprocessors. For the continuous and the categorical performance metrics examined, the Kalman filter bias adjustment technique performed better than the hybrid bias correction technique. Full article
(This article belongs to the Special Issue Regional Air Quality Modeling)
Show Figures

Figure 1

12 pages, 3066 KiB  
Article
June–July Temperature Reconstruction of Kashmir Valley from Tree Rings of Himalayan Pindrow Fir
by Rayees Malik and Raman Sukumar
Atmosphere 2021, 12(3), 410; https://doi.org/10.3390/atmos12030410 - 23 Mar 2021
Cited by 8 | Viewed by 2924
Abstract
The Himalaya is one of the major mountain ecosystems that is most likely to be impacted by climate change. The main drawback in understanding climate change in the remote Himalayan ecosystems is the lack of long-term instrumental climate records. Reconstructing past climates from [...] Read more.
The Himalaya is one of the major mountain ecosystems that is most likely to be impacted by climate change. The main drawback in understanding climate change in the remote Himalayan ecosystems is the lack of long-term instrumental climate records. Reconstructing past climates from tree-rings offers a useful proxy for adding data to the instrumental climate records. In this study, climatically sensitive tree-rings of Himalayan fir (Abies pindrow) were used for reconstruction of mean June–July temperatures of Kashmir valley. Total ring-width chronology was built from 60 tree-ring cores growing near the higher altitudinal limits of the species. The radial growth showed a strong positive response to growing season temperature. The strong response of site chronology to mean June–July temperatures was used for reconstruction purposes. Mean June–July temperatures of Kashmir valley were reconstructed since 1773 from residual site chronology. Though the reconstruction did not show any strong long-term trend, on a centennial-scale, 20th-century summers were the warmest with a mean annual summer temperature of 22.99 °C. Seven of the warmest years and five of the warmest decades were seen in the 20th century. The reconstruction for 1773–2012 showed 23 extreme hot summers above the hot threshold of a 23.47 °C mean temperature and 19 extreme cold years below the cold threshold of a 22.46 °C mean summer temperature. The cold years in the reconstruction did not coincide with known volcanic eruptions. This reconstruction will help in providing a better understanding of regional climate change. Full article
(This article belongs to the Special Issue Past Climate Reconstructed from Tree Rings)
Show Figures

Figure 1

16 pages, 1350 KiB  
Article
The Impact of the Variation in Weather and Season on WRF Dynamical Downscaling in the Pearl River Delta Region
by Chengwei Zhang, Jianjun He, Xin Lai, Yilin Liu, Huizheng Che and Sunling Gong
Atmosphere 2021, 12(3), 409; https://doi.org/10.3390/atmos12030409 - 21 Mar 2021
Cited by 5 | Viewed by 2776
Abstract
In this study, National Centers for Environmental Prediction (NCEP) Final (FNL) operational global analysis data and meteorological observation data from 2013 to 2017 were used to evaluate the impact of seasonal changes and different circulation classifications on the dynamical downscaling simulation results of [...] Read more.
In this study, National Centers for Environmental Prediction (NCEP) Final (FNL) operational global analysis data and meteorological observation data from 2013 to 2017 were used to evaluate the impact of seasonal changes and different circulation classifications on the dynamical downscaling simulation results of Weather Research and Forecasting (WRF) in the Pearl River Delta (PRD) region. The results show that the dynamical downscaling method can accurately simulate the time variation characteristics of the near-surface meteorological field and the hit rates of a 2-m temperature, 2-m relative humidity, 10-m wind speed, and 10-m wind direction are 92.66%, 93.98%, 26.78%, and 76.78%, respectively. The WRF model slightly underestimates the temperature and relative humidity, and overestimates the wind speed and precipitation. For precipitation, the WRF model can better simulate the variation characteristics of light rain and heavy rain, with the probability of detection are 0.59 and 0.69, respectively. For seasonal factors, the WRF model can conduct a perfect simulation in autumn and winter, followed by spring, while summer is vulnerable to extreme weather, so the result of the simulation is relatively poor. The circulation type is an important parameter of downscaling assessment. When the PRD is controlled by high pressure, the simulated results of WRF are good, and when the PRD is affected by low pressure or extreme weather, the simulation results are relatively poor. Full article
Show Figures

Figure 1

29 pages, 12058 KiB  
Article
Analysis of Extreme Meteorological Events in the Central Andes of Peru Using a Set of Specialized Instruments
by José Luis Flores-Rojas, Yamina Silva, Luis Suárez-Salas, René Estevan, Jairo Valdivia-Prado, Miguel Saavedra, Lucy Giraldez, Manuel Piñas-Laura, Danny Scipión, Marco Milla, Sheilendra Kumar and Daniel Martinez-Castro
Atmosphere 2021, 12(3), 408; https://doi.org/10.3390/atmos12030408 - 21 Mar 2021
Cited by 9 | Viewed by 3772
Abstract
A set of instruments to measure several physical, microphysical, and radiative properties of the atmosphere and clouds are essential to identify, understand and, subsequently, forecast and prevent the effects of extreme meteorological events, such as severe rainfall, hailstorms, frost events and high pollution [...] Read more.
A set of instruments to measure several physical, microphysical, and radiative properties of the atmosphere and clouds are essential to identify, understand and, subsequently, forecast and prevent the effects of extreme meteorological events, such as severe rainfall, hailstorms, frost events and high pollution events, that can occur with some regularity in the central Andes of Peru. However, like many other Latin American countries, Peru lacks an adequate network of meteorological stations to identify and analyze extreme meteorological events. To partially remedy this deficiency, the Geophysical Institute of Peru has installed a set of specialized sensors (LAMAR) on the Huancayo observatory (12.04° S, 75.32° W, 3350 m ASL), located in the Mantaro river basin, which is a part of the central Andes of Peru, especially in agricultural areas. LAMAR consists of a set of sensors that are used to measure the main atmosphere and soil variables located in a 30-meter-high tower. It also has a set of high-quality radiation sensors (BSRN station) that helps measure the components of short-wave (SW) (global, diffuse, direct and reflected) and long-wave (LW) (emitted and incident) irradiance mounted in a 6-meter-high tower. Moreover, to analyze the microphysics properties of clouds and rainfall, LAMAR includes a set of profiler radars: A Ka-band cloud profiler (MIRA-35c), a UHF wind profiler (CLAIRE), and a VHF wind profiler (BLTR), along with two disdrometers (PARSIVEL2) and two rain gauges pluviometers. The present study performs a detailed dynamic and energetic analysis of two extreme rainfall events, two intense frost events, and three high-pollution events occurring on the Huancayo observatory between 2018 and 2019. The results show that the rainfall events are similar to the 1965–2019 climatological 90th percentile of the daily accumulated rainfall. The results also highlighted the patterns of reflectivity in function of height for both events, which is measured by highlighting the presence of convective and stratiform rainfall types for both events. The first intense rainfall event was associated with strong easterly circulations at high levels of the atmosphere, and the second one was associated with the presence of strong westerly circulations and the absence of BH-NL system around the central Andes. The first frost event was mainly associated with continuous clear sky conditions in the few previous days, corresponding to a radiative frost event. The second one was mainly associated with the intrusion of cold surges from extra-tropical South America. For both events, the energy budget components were strong-lower in comparison to the mean monthly values during early morning hours. Finally, for the high pollution events, the study identified that the main source of aerosols were the forest fires that took place in Peru with certain contributions from the fires in the northern area of Bolivia. Full article
(This article belongs to the Section Atmospheric Techniques, Instruments, and Modeling)
Show Figures

Figure 1

14 pages, 3731 KiB  
Article
Impact on Ultrafine Particles Concentration and Turbulent Fluxes of SARS-CoV-2 Lockdown in a Suburban Area in Italy
by Antonio Donateo, Adelaide Dinoi and Gianluca Pappaccogli
Atmosphere 2021, 12(3), 407; https://doi.org/10.3390/atmos12030407 - 21 Mar 2021
Cited by 8 | Viewed by 2784
Abstract
In order to slow the spread of SARS-CoV-2, governments have implemented several restrictive measures (lockdown, stay-in-place, and quarantine policies). These provisions have drastically changed the routines of residents, altering environmental conditions in the affected areas. In this context, our work analyzes the effects [...] Read more.
In order to slow the spread of SARS-CoV-2, governments have implemented several restrictive measures (lockdown, stay-in-place, and quarantine policies). These provisions have drastically changed the routines of residents, altering environmental conditions in the affected areas. In this context, our work analyzes the effects of the reduced emissions during the COVID-19 period on the ultrafine particles number concentration and their turbulent fluxes in a suburban area. COVID-19 restrictions did not significantly reduce anthropogenic related PM10 and PM2.5 levels, with an equal decrement of about 14%. The ultrafine particle number concentration during the lockdown period decreased by 64% in our measurement area, essentially due to the lower traffic activity. The effect of the restriction measures and the reduction of vehicles traffic was predominant in reducing concentration rather than meteorological forcing. During the lockdown in 2020, a decrease of 61% in ultrafine particle positive fluxes can be observed. At the same time, negative fluxes decreased by 59% and our observation site behaved, essentially, as a sink of ultrafine particles. Due to this behavior, we can conclude that the principal particle sources during the lockdown were far away from the measurement site. Full article
(This article belongs to the Section Aerosols)
Show Figures

Graphical abstract

18 pages, 9941 KiB  
Article
Estimating the CMIP6 Anthropogenic Aerosol Radiative Effects with the Advantage of Prescribed Aerosol Forcing
by Xiangjun Shi, Chunhan Li, Lijuan Li, Wentao Zhang and Jiaojiao Liu
Atmosphere 2021, 12(3), 406; https://doi.org/10.3390/atmos12030406 - 21 Mar 2021
Cited by 3 | Viewed by 2909
Abstract
The prescribed anthropogenic aerosol forcing recommended by Coupled Model Intercomparison Project Phase 6 (CMIP6) was implemented in an atmospheric model. With the reduced complexity of anthropogenic aerosol forcing, each component of anthropogenic aerosol effective radiative forcing (ERF) can be estimated by one or [...] Read more.
The prescribed anthropogenic aerosol forcing recommended by Coupled Model Intercomparison Project Phase 6 (CMIP6) was implemented in an atmospheric model. With the reduced complexity of anthropogenic aerosol forcing, each component of anthropogenic aerosol effective radiative forcing (ERF) can be estimated by one or more calculation methods, especially for instantaneous radiative forcing (RF) from aerosol–radiation interactions (RFari) and aerosol–cloud interactions (RFaci). Simulation results show that the choice of calculation method might impact the magnitude and reliability of RFari. The RFaci—calculated by double radiation calls—is the definition-based Twomey effect, which previously was impossible to diagnose using the default model with physically based aerosol–cloud interactions. The RFari and RFaci determined from present-day simulations are very robust and can be used as offline simulation results. The robust RFari, RFaci, and corresponding radiative forcing efficiencies (i.e., the impact of environmental properties) are very useful for analyzing anthropogenic aerosol radiative effects. For instance, from 1975 to 2000, both RFari and RFaci showed a clear response to the spatial change of anthropogenic aerosol. The global average RF (RFari + RFaci) has enhanced (more negative) by ~6%, even with a slight decrease in the global average anthropogenic aerosol, and this can be explained by the spatial pattern of radiative forcing efficiency. Full article
Show Figures

Figure 1

20 pages, 918 KiB  
Review
Energy-Efficiency Requirements for Residential Building Envelopes in Cold-Climate Regions
by Amy Huynh, Regina Dias Barkokebas, Mohamed Al-Hussein, Carlos Cruz-Noguez and Yuxiang Chen
Atmosphere 2021, 12(3), 405; https://doi.org/10.3390/atmos12030405 - 20 Mar 2021
Cited by 16 | Viewed by 5127
Abstract
Due to the energy and environmental impacts attributed to the operational phase of the building sector, efforts have been made to improve building energy performance through the implementation of restrictive energy requirements by regulatory bodies. In this context, the primary objective of this [...] Read more.
Due to the energy and environmental impacts attributed to the operational phase of the building sector, efforts have been made to improve building energy performance through the implementation of restrictive energy requirements by regulatory bodies. In this context, the primary objective of this paper is to investigate and compare regulations that govern the building envelope energy performance of new residential buildings in cold-climate regions, primarily in Canada, Finland, Iceland, Norway, Sweden, China, and Russia. The aim is to identify similarities and dissimilarities among the energy regulations of these countries, as well as potentials for development of more effective building codes. This study verifies that the investigated energy requirements diverge considerably—for instance, the required thermal resistance per unit area of above-grade exterior walls in Sweden is almost two times that of a similar climate zone in Canada. Based on the comparisons and case analyses, recommendations for energy requirements pertinent to building envelope of new residential buildings in cold-climate regions are proposed. Full article
(This article belongs to the Special Issue Building Energy Codes and Greenhouse Gas Mitigation)
Show Figures

Figure 1

15 pages, 744 KiB  
Article
Species of Fungi and Pollen in the PM1 and the Inhalable Fraction of Indoor Air in Homes
by Rui Lu, Ann Dorte Pørneki, Jonas N. Lindgreen, Yanpeng Li and Anne Mette Madsen
Atmosphere 2021, 12(3), 404; https://doi.org/10.3390/atmos12030404 - 20 Mar 2021
Cited by 10 | Viewed by 3328
Abstract
Airborne microbial fragments in the PM1 fraction (particles with aerodynamic diameters less than 1 µm) are a cause for concern as they may potentially deposit in the alveoli of the human airways. This study aimed to use qPCR to identify and quantify [...] Read more.
Airborne microbial fragments in the PM1 fraction (particles with aerodynamic diameters less than 1 µm) are a cause for concern as they may potentially deposit in the alveoli of the human airways. This study aimed to use qPCR to identify and quantify 24 different species or groups of genera in the PM1 and the inhalation fraction (particles that may enter the mouth or nose during breathing) of indoor air and to relate this to what has previously been found for each species. Results showed that eight fungal species, and Aspergillus/Penicillium/Paecilomyces variotii, as well as Alnus/Corylus and actinobacteria belonging to the Streptomyces genus were detected both in the PM1 and the inhalable fraction. Five fungal species were only detected in the inhalable fraction. A significant effect of season was found on the fungal composition in the PM1 (p = 0.001) and the inhalable (p = 0.017) fraction. This study demonstrated that it is possible to use qPCR to identify and quantify different microbes in the PM1 fraction, and it has improved our understanding of the qualitative and quantitative relationship between the PM1 and the inhalable microbial particles in indoor air. Combined with the literature review it also shows a large variation within and between species in the share of fungi which is present as fragments. Full article
(This article belongs to the Section Aerosols)
Show Figures

Figure 1

18 pages, 5508 KiB  
Article
Improved Algorithms for Remote Sensing-Based Aerosol Retrieval during Extreme Biomass Burning Events
by Sonoyo Mukai, Itaru Sano and Makiko Nakata
Atmosphere 2021, 12(3), 403; https://doi.org/10.3390/atmos12030403 - 20 Mar 2021
Cited by 18 | Viewed by 3030
Abstract
This study proposed an aerosol characterization process using satellites for severe biomass burning events. In general, these severely hazy cases are labeled as “undecided” or “hazy.” Because atmospheric aerosols are significantly affected by factors such as air quality, global climate change, local environmental [...] Read more.
This study proposed an aerosol characterization process using satellites for severe biomass burning events. In general, these severely hazy cases are labeled as “undecided” or “hazy.” Because atmospheric aerosols are significantly affected by factors such as air quality, global climate change, local environmental risk, and human and biological health, efficient and accurate algorithms for aerosol retrieval are required for global satellite data processing. Our previous classification of aerosol types was based primarily on near-ultraviolet (UV) data, which facilitated subsequent aerosol retrieval. In this study, algorithms for aerosol classification were expanded to events with serious biomass burning aerosols (SBBAs). Once a biomass burning event is identified, the appropriate radiation simulation method can be applied to characterize the SBBAs. The second-generation global imager (SGLI) on board the Japanese mission JAXA/Global Change Observation Mission-Climate contains 19 channels, including red (674 nm) and near-infrared (869 nm) polarization channels with a high resolution of 1 km. Using the large-scale wildfires in Kalimantan, Indonesia in 2019 as an example, the complementarity between the polarization information and the nonpolarized radiance measurements from the SGLI was demonstrated to be effective in radiation simulations for biomass burning aerosol retrieval. The retrieved results were verified using NASA/AERONET ground-based measurements, and then compared against JAXA/SGLI/L2-version-1 products, and JMA/Himawari-8/AHI observations. Full article
(This article belongs to the Special Issue Aerosol Pollution in Asia)
Show Figures

Figure 1

26 pages, 6983 KiB  
Article
High Energy Parametric Laser Source and Frequency-Comb-Based Wavelength Reference for CO2 and Water Vapor DIAL in the 2 µm Region: Design and Pre-Development Experimentations
by Jonas Hamperl, Jan Fabian Geus, Kjell M. Mølster, Andrius Zukauskas, Jean-Baptiste Dherbecourt, Valdas Pasiskevicius, Lukas Nagy, Oliver Pitz, David Fehrenbacher, Hanjo Schaefer, Dirk Heinecke, Michael Strotkamp, Stephan Rapp, Paul Denk, Norbert Graf, Marine Dalin, Vincent Lebat, Rosa Santagata, Jean-Michel Melkonian, Antoine Godard, Myriam Raybaut and Cyrille Flamantadd Show full author list remove Hide full author list
Atmosphere 2021, 12(3), 402; https://doi.org/10.3390/atmos12030402 - 20 Mar 2021
Cited by 17 | Viewed by 4473
Abstract
We present a differential absorption lidar (DIAL) laser transmitter concept designed around a Nested Cavity Optical Parametric Oscillator (NesCOPO) based Master Oscillator Power Amplifier (MOPA). The spectral bands are located around 2051 nm for CO2 probing and 1982 nm for H2 [...] Read more.
We present a differential absorption lidar (DIAL) laser transmitter concept designed around a Nested Cavity Optical Parametric Oscillator (NesCOPO) based Master Oscillator Power Amplifier (MOPA). The spectral bands are located around 2051 nm for CO2 probing and 1982 nm for H216O and HD16O water vapor isotopes. This laser is aimed at being integrated into an airborne lidar, intended to demonstrate future spaceborne instrument characteristics: high-energy (several tens of mJ nanosecond pulses) and high optical frequency stability (less than a few hundreds of kHz long term drift). For integration and efficiency purposes, the proposed design is oriented toward the use of state-of-the-art high aperture periodically poled nonlinear materials. This approach is supported by numerical calculations and preliminary experimental validations, showing that it is possible to achieve energies in the 40–50 mJ range, reaching the requirement levels for spaceborne Integrated Path Differential Absorption (IPDA) measurements. We also propose a frequency referencing technique based on beat note measurement of the laser signal with a self-stabilized optical frequency comb, which is expected to enable frequency measurement precisions better than a few 100 kHz over tens of seconds integration time, and will then be used to feed the cavity locking of the NesCOPO. Full article
(This article belongs to the Special Issue Remote Sensing of Atmospheric Carbon Dioxide)
Show Figures

Figure 1

14 pages, 4164 KiB  
Article
Ventilation of a Mid-Size City under Stable Boundary Layer Conditions: A Simulation Using the LES Model PALM
by Jonathan Lukas Biehl, Bastian Paas and Otto Klemm
Atmosphere 2021, 12(3), 401; https://doi.org/10.3390/atmos12030401 - 20 Mar 2021
Cited by 6 | Viewed by 2900
Abstract
City centers have to cope with an increasing amount of air pollution. The supply of fresh air is crucial yet difficult to ensure, especially under stable conditions of the atmospheric boundary layer. This case study used the PArallelized Large eddy simulation (LES) Model [...] Read more.
City centers have to cope with an increasing amount of air pollution. The supply of fresh air is crucial yet difficult to ensure, especially under stable conditions of the atmospheric boundary layer. This case study used the PArallelized Large eddy simulation (LES) Model PALM to investigate the wind field over an urban lake that had once been built as a designated fresh air corridor for the city center of Münster, northwest, Germany. The model initialization was performed using the main wind direction and stable boundary layer conditions as input. The initial wind and temperature profiles included a weak nocturnal low-level jet. By emitting a passive scalar at one point on top of a bridge, the dispersion of fresh air could be traced over the lake’s surface, within street canyons leading to the city center and within the urban boundary layer above. The concept of city ventilation was confirmed in principle, but the air took a direct route from the shore of the lake to the city center above a former river bed and its adjoining streets rather than through the street canyons. According to the dispersion of the passive scalar, half of the city center was supplied with fresh air originating from the lake. PALM proved to be a useful tool to study fresh air corridors under stable boundary layer conditions. Full article
(This article belongs to the Special Issue The Stable Boundary Layer: Observations and Modeling)
Show Figures

Figure 1

19 pages, 1831 KiB  
Article
An Assessment of Indoor Air Quality in the Arrivals Hall of Beirut–Rafic Hariri International Airport: Monitoring of VOCs and NO2
by Tharwat Mokalled, Jocelyne Adjizian Gérard, Maher Abboud, Céline Liaud, Rouba Nasreddine and Stéphane Le Calvé
Atmosphere 2021, 12(3), 400; https://doi.org/10.3390/atmos12030400 - 20 Mar 2021
Cited by 8 | Viewed by 4228
Abstract
In Beirut–Rafic Hariri International Airport (RHIA), airport employees stay at least 12 h inside the airport’s buildings and suffer from respiratory symptoms. Additionally, direct openings exist between the apron and the arrivals hall providing a pathway for contaminated air to enter the buildings. [...] Read more.
In Beirut–Rafic Hariri International Airport (RHIA), airport employees stay at least 12 h inside the airport’s buildings and suffer from respiratory symptoms. Additionally, direct openings exist between the apron and the arrivals hall providing a pathway for contaminated air to enter the buildings. Hence, we study the impact of Beirut–RHIA’s activities on the indoor air of the arrivals hall (impact on employees and passengers) during June, November, and October 2014. Due to their impacts on air quality and human health, assessing of the concentrations of nitrogen dioxide (NO2) and Volatile Organic Compounds (VOCs) was the target of our study by using gas chromatographic techniques (GC-MS and GC-FID) for VOCs and calorimetric methods for NO2 concentrations. NO2 levels indicated a probable hazard to the health of passengers and employees, while measured VOC levels did not present any risks except for acrolein. This is the first study to assess the speciation of a large number of VOCs (46 VOCs) for airport indoor air while revealing a very interesting correlation between aircraft number and the concentrations of VOC groups (namely heavy alkanes, aldehydes and ketones, and monoaromatics). Moreover, this is the first study in Lebanon to assess the speciation of a large number of VOCs in indoor air. Full article
(This article belongs to the Special Issue VOC Sensing and Measurements)
Show Figures

Graphical abstract

13 pages, 6608 KiB  
Article
Refined Characteristics of Moisture Cycling over the Inland River Basin Using the WRF Model and the Finer Box Model: A Case Study of the Heihe River Basin
by Xiaoduo Pan, Weiqiang Ma, Ying Zhang and Hu Li
Atmosphere 2021, 12(3), 399; https://doi.org/10.3390/atmos12030399 - 20 Mar 2021
Cited by 5 | Viewed by 2496
Abstract
The Heihe River Basin (HRB), located on the northeastern edge of the Tibetan Plateau, is the second-largest inland river basin in China, with an area of 140,000 km2. The HRB is a coupling area of the westerlies, the Qinghai–Tibet Plateau monsoon [...] Read more.
The Heihe River Basin (HRB), located on the northeastern edge of the Tibetan Plateau, is the second-largest inland river basin in China, with an area of 140,000 km2. The HRB is a coupling area of the westerlies, the Qinghai–Tibet Plateau monsoon and the Southeast monsoon circulation system, and is a relatively independent land-surface water-circulating system. The refined characteristics of moisture recycling over the HRB was described by using the Weather Research and Forecasting (WRF) model for a long-term simulation, and the “finer box model” for calculating the net water-vapor flux. The following conclusions were drawn from the results of this study: (1) The water vapor of the HRB was dominantly transported by the wind from the west and from the north, and the west one was much larger than the north one. The net vapor transported by the west wind was positive, and by the north wind was negative. (2) The precipitation over the HRB was triggered mainly by the vapor from the west, which arose from the lower vertical layer to higher one during transporting from west to east. The vapor from the north sank from a higher layer to a lower one, and crossed the south edge of the HRB. (3) The moisture-recycling ratio of evapotranspiration to precipitation over the HRB was much higher than the other regions, which may be due to the strong land–atmosphere interaction in the arid inland river basin. Full article
Show Figures

Figure 1

17 pages, 4191 KiB  
Article
Tropospheric NO2 Pollution Monitoring with the GF-5 Satellite Environmental Trace Gases Monitoring Instrument over the North China Plain during Winter 2018–2019
by Dongshang Yang, Yuhan Luo, Yi Zeng, Fuqi Si, Liang Xi, Haijin Zhou and Wenqing Liu
Atmosphere 2021, 12(3), 398; https://doi.org/10.3390/atmos12030398 - 19 Mar 2021
Cited by 6 | Viewed by 2665
Abstract
The Environmental Trace Gases Monitoring Instrument (EMI) is a high-spectral-resolution payload onboard the latest pathfinder mission GaoFen-5, designed specifically for the monitoring of global atmospheric trace gas compositions and trends. This study describes a comparative analysis of the tropospheric nitrogen dioxide (NO2 [...] Read more.
The Environmental Trace Gases Monitoring Instrument (EMI) is a high-spectral-resolution payload onboard the latest pathfinder mission GaoFen-5, designed specifically for the monitoring of global atmospheric trace gas compositions and trends. This study describes a comparative analysis of the tropospheric nitrogen dioxide (NO2) columns over the North China Plain (NCP) from November 2018 to April 2019 based on EMI products. Validation of satellite products based on a cross-correlation analysis with data from four ground-based multi-axis differential optical absorption spectroscopy sites provided good correlation coefficients (r) ranging from 0.78 to 0.88. The distribution and monthly averaged tropospheric NO2 columns revealed high pollution exposure levels during winter (November–January) and a decrease from February onward in the NCP. Moreover, a typical pollution event was analyzed in detail in combination with wind field statistics. The results indicated that variations of NO2 concentrations in Beijing and Tianjin were highly correlated with the wind direction from 22.5–45.0 degrees west of south, especially during times of high NO2 amounts. These findings highlight that the EMI payload on the GaoFen-5 (GF-5) satellite is useful for remote sensing of regional and global NO2 detection. Full article
(This article belongs to the Section Atmospheric Techniques, Instruments, and Modeling)
Show Figures

Graphical abstract

18 pages, 5153 KiB  
Article
Measured Solid State and Sub-Cooled Liquid Vapour Pressures of Benzaldehydes Using Knudsen Effusion Mass Spectrometry
by Petroc Shelley, Thomas J. Bannan, Stephen D. Worrall, M. Rami Alfarra, Carl J. Percival, Arthur Garforth and David Topping
Atmosphere 2021, 12(3), 397; https://doi.org/10.3390/atmos12030397 - 19 Mar 2021
Cited by 1 | Viewed by 2647
Abstract
Benzaldehydes are components of atmospheric aerosol that are poorly represented in current vapour pressure predictive techniques. In this study the solid state (PSsat) and sub-cooled liquid saturation vapour pressures (PLsat) were measured over a range [...] Read more.
Benzaldehydes are components of atmospheric aerosol that are poorly represented in current vapour pressure predictive techniques. In this study the solid state (PSsat) and sub-cooled liquid saturation vapour pressures (PLsat) were measured over a range of temperatures (298–328 K) for a chemically diverse group of benzaldehydes. The selected benzaldehydes allowed for the effects of varied geometric isomers and functionalities on saturation vapour pressure (Psat) to be probed. PSsat was measured using Knudsen effusion mass spectrometry (KEMS) and PLsat was obtained via a sub-cooled correction utilising experimental enthalpy of fusion and melting point values measured using differential scanning calorimetry (DSC). The strength of the hydrogen bond (H-bond) was the most important factor for determining PLsat when a H-bond was present and the polarisability of the compound was the most important factor when a H-bond was not present. Typically compounds capable of hydrogen bonding had PLsat 1 to 2 orders of magnitude lower than those that could not H-bond. The PLsat were compared to estimated values using three different predictive techniques (Nannoolal et al. vapour pressure method, Myrdal and Yalkowsky method, and SIMPOL). The Nannoolal et al. vapour pressure method and the Myrdal and Yalkowsky method require the use of a boiling point method to predict Psat. For the compounds in this study the Nannoolal et al. boiling point method showed the best performance. All three predictive techniques showed less than an order of magnitude error in PLsat on average, however more significant errors were within these methods. Such errors will have important implications for studies trying to ascertain the role of these compounds on aerosol growth and human health impacts. SIMPOL predicted PLsat the closest to the experimentally determined values. Full article
(This article belongs to the Section Aerosols)
Show Figures

Figure 1

15 pages, 5255 KiB  
Article
Identification of High Personal PM2.5 Exposure during Real Time Commuting in the Taipei Metropolitan Area
by Cheng-Yi Wang, Biing-Suan Lim, Ya-Hui Wang and Yuh-Chin T. Huang
Atmosphere 2021, 12(3), 396; https://doi.org/10.3390/atmos12030396 - 19 Mar 2021
Cited by 13 | Viewed by 2919
Abstract
There has been an increase in the network of mass rapid transit (MRT) and the number of automobiles over the past decades in the Taipei metropolitan area, Taiwan. The effects of these changes on PM2.5 exposure for the residents using different modes [...] Read more.
There has been an increase in the network of mass rapid transit (MRT) and the number of automobiles over the past decades in the Taipei metropolitan area, Taiwan. The effects of these changes on PM2.5 exposure for the residents using different modes of transportation are unclear. Volunteers measured PM2.5 concentrations while commuting in different modes of transportation using a portable PM2.5 detector. Exposure to PM2.5 (median (range)) was higher when walking along the streets (40 (10–275) µg/m3) compared to riding the buses (35 (13–65) µg/m3) and the cars (15 (8–80) µg/m3). PM2.5 concentrations were higher in underground MRT stations (80 (30–210) µg/m3) and inside MRT cars running in underground sections (80 (55–185) µg/m3) than those in elevated MRT stations (33 (15–35) µg/m3) and inside MRT cars running in elevated sections (28 (13–68) µg/m3) (p < 0.0001). Riding motorcycle also was associated with high PM2.5 exposure (75 (60–105 µg/m3), p < 0.0001 vs. walking). High PM2.5 concentrations were noted near the temples (588 ± 271 µg/m3) and in the underground food court of a night market (405 ± 238 µg/m3) where the eatery stalls stir-fried and grilled food (p < 0.0001 vs. walking). We conclude that residents in the Taipei metropolitan area may still be exposed to high PM2.5 during some forms of commuting, including riding underground MRT. Full article
(This article belongs to the Special Issue Contributions of Aerosol Sources to Health Impacts)
Show Figures

Figure 1

28 pages, 12389 KiB  
Article
Prediction of Solar Irradiance and Photovoltaic Solar Energy Product Based on Cloud Coverage Estimation Using Machine Learning Methods
by Seongha Park, Yongho Kim, Nicola J. Ferrier, Scott M. Collis, Rajesh Sankaran and Pete H. Beckman
Atmosphere 2021, 12(3), 395; https://doi.org/10.3390/atmos12030395 - 18 Mar 2021
Cited by 50 | Viewed by 8471
Abstract
Cloud cover estimation from images taken by sky-facing cameras can be an important input for analyzing current weather conditions and estimating photovoltaic power generation. The constant change in position, shape, and density of clouds, however, makes the development of a robust computational method [...] Read more.
Cloud cover estimation from images taken by sky-facing cameras can be an important input for analyzing current weather conditions and estimating photovoltaic power generation. The constant change in position, shape, and density of clouds, however, makes the development of a robust computational method for cloud cover estimation challenging. Accurately determining the edge of clouds and hence the separation between clouds and clear sky is difficult and often impossible. Toward determining cloud cover for estimating photovoltaic output, we propose using machine learning methods for cloud segmentation. We compare several methods including a classical regression model, deep learning methods, and boosting methods that combine results from the other machine learning models. To train each of the machine learning models with various sky conditions, we supplemented the existing Singapore whole sky imaging segmentation database with hazy and overcast images collected by a camera-equipped Waggle sensor node. We found that the U-Net architecture, one of the deep neural networks we utilized, segmented cloud pixels most accurately. However, the accuracy of segmenting cloud pixels did not guarantee high accuracy of estimating solar irradiance. We confirmed that the cloud cover ratio is directly related to solar irradiance. Additionally, we confirmed that solar irradiance and solar power output are closely related; hence, by predicting solar irradiance, we can estimate solar power output. This study demonstrates that sky-facing cameras with machine learning methods can be used to estimate solar power output. This ground-based approach provides an inexpensive way to understand solar irradiance and estimate production from photovoltaic solar facilities. Full article
(This article belongs to the Special Issue Machine Learning Applications in Earth System Science)
Show Figures

Figure 1

19 pages, 2974 KiB  
Article
One-Year Real-Time Measurement of Black Carbon in the Rural Area of Qingdao, Northeastern China: Seasonal Variations, Meteorological Effects, and the COVID-19 Case Analysis
by Shijie Cui, Jiukun Xian, Fuzhen Shen, Lin Zhang, Baoling Deng, Yunjiang Zhang and Xinlei Ge
Atmosphere 2021, 12(3), 394; https://doi.org/10.3390/atmos12030394 - 18 Mar 2021
Cited by 18 | Viewed by 4424
Abstract
In this paper, we report the results obtained from one year of real-time measurement (i.e., from December 2019 to November 2020) of atmospheric black carbon (BC) under a rural environment in Qingdao of Northeastern China. The annual average concentration of BC was 1.92 [...] Read more.
In this paper, we report the results obtained from one year of real-time measurement (i.e., from December 2019 to November 2020) of atmospheric black carbon (BC) under a rural environment in Qingdao of Northeastern China. The annual average concentration of BC was 1.92 ± 1.89 μg m−3. The highest average concentration of BC was observed in winter (3.65 ± 2.66 μg m−3), followed by fall (1.73 ± 1.33 μg m−3), spring (1.53 ± 1.33 μg m−3), and summer (0.83 ± 0.56 μg m−3). A clear weekend effect was observed in winter, which was characterized by higher BC concentration (4.60 ± 2.86 μg m−3) during the weekend rather than that (3.22 ± 2.45 μg m−3) during weekdays. The influence of meteorological parameters, including surface horizontal wind speed, boundary layer height (BLH), and precipitation, on BC, was investigated. In particular, such BLH influence presented evidently seasonal dependence, while there was no significant seasonality for horizontal wind speed. These may reflect different roles of atmospheric vertical dilution on affecting BC in different seasons. The △BC/△CO ratio decreased with the increase of precipitation, indicative of the influence of below-cloud wet removal of BC, especially during summertime where rainfall events more frequently occurred than any of other seasons. The bivariate-polar-plot analysis showed that the high BC concentrations were mainly associated with low wind speed in all seasons, highlighting an important BC source originated from local emissions. By using concentration-weighted trajectory analysis, it was found that regional transports, especially from northeastern in winter, could not be negligible for contributing to BC pollution in rural Qingdao. In the coronavirus disease 2019 (COVID−19) case analysis, we observed an obvious increase in the BC/NO2 ratio during the COVID-19 lockdown, supporting the significant non-traffic source sector (such as residential coal combustion) for BC in rural Qingdao. Full article
Show Figures

Figure 1

18 pages, 3506 KiB  
Article
Spatial Variability of Glaciochemistry along a Transect from Zhongshan Station to LGB69, Antarctica
by Weilong Huang, Ming Yan, Robert Mulvaney, Zuoqin Qian, Leibao Liu, Chunlei An, Cunde Xiao and Yujia Zhang
Atmosphere 2021, 12(3), 393; https://doi.org/10.3390/atmos12030393 - 17 Mar 2021
Cited by 2 | Viewed by 2633
Abstract
The spatial glaciochemical variability of snow samples collected along a transect from Zhongshan Station to Lambert Glacier Basin 69 (LGB69) in Antarctica was investigated. Sea-salt ion concentrations exponentially decreased with increasing distance from the coast and/or altitude. The observed high sea-salt ion concentrations [...] Read more.
The spatial glaciochemical variability of snow samples collected along a transect from Zhongshan Station to Lambert Glacier Basin 69 (LGB69) in Antarctica was investigated. Sea-salt ion concentrations exponentially decreased with increasing distance from the coast and/or altitude. The observed high sea-salt ion concentrations within 20.6 km of the coast may be related to preferential wet or dry deposition of sea-salt aerosols. Methanesulfonic acid (MSA), non-sea-salt sulfate (nssSO42−), and calcium (Ca2+) concentrations decreased along the transect. The mean MSA/nssSO42− value of the surface snow samples (0.34 ± 0.08) indicates that coastal sea areas are their likely source regions. The non-sea-salt Ca2+ (nssCa2+)/Ca2+ percentages of the surface snow and LGB69 snow pit samples reveal that continental dust is the primary Ca2+ source. The δD and δ18O values decreased from the coast inland. The variation of deuterium excess (d-excess) along the transect was stable and d-excess values in the two snow pit samples were low and similar, which indicates that the moisture source region between Zhongshan Station and LGB69 is a coastal sea area. These results reveal the spatial distribution patterns and sources of ions and stable isotopes, as well as factors that influence the deposition of ions and the composition of stable isotopes, which provide important insight for further studies of ice cores drilled in Antarctic coastal regions. Full article
(This article belongs to the Special Issue Interactions between the Cryosphere and Climate (Change))
Show Figures

Figure 1

17 pages, 8027 KiB  
Article
Testing the Drop-Size Distribution-Based Separation of Stratiform and Convective Rain Using Radar and Disdrometer Data from a Mid-Latitude Coastal Region
by Merhala Thurai, Viswanathan Bringi, David Wolff, David Marks and Charanjit Pabla
Atmosphere 2021, 12(3), 392; https://doi.org/10.3390/atmos12030392 - 17 Mar 2021
Cited by 8 | Viewed by 2804
Abstract
Stratiform and convective rain are associated with different microphysical processes and generally produce drop-size distributions (DSDs) with different characteristics. Previous studies using data from (a) a tropical coastal location, (b) a mid-latitude continental location with semi-arid climate, and (c) a sub-tropical continental location, [...] Read more.
Stratiform and convective rain are associated with different microphysical processes and generally produce drop-size distributions (DSDs) with different characteristics. Previous studies using data from (a) a tropical coastal location, (b) a mid-latitude continental location with semi-arid climate, and (c) a sub-tropical continental location, found that the two rain types could be separated in the NW–Dm space, where Dm is the mass-weighted mean diameter and NW is the normalized intercept parameter. In this paper, we investigate the same separation technique using data and observations from a mid-latitude coastal region. Three-minute DSDs from disdrometer measurements are used for the NW- versus Dm-based classification and are compared with simultaneous observations from an S-band polarimetric radar 38 km away from the disdrometer site. Specifically, RHI (range-height indicator) scans over the disdrometer were used for confirmation. Results show that there was no need to modify the separation criteria from previous studies. Three-minute DSDs from the same location were used as input to scattering calculations to derive retrieval equations for NW and Dm for the S-band radar using an improved technique and applied to the RHI scans to identify convective and stratiform rain regions. Two events are shown as illustrative examples. Full article
Show Figures

Figure 1

14 pages, 6524 KiB  
Article
Asymmetric Effect of El Niño—Southern Oscillation on the Spring Precipitation over South China
by Bei Xu, Gen Li, Chujie Gao, Hong Yan, Ziqian Wang, Yang Li and Siguang Zhu
Atmosphere 2021, 12(3), 391; https://doi.org/10.3390/atmos12030391 - 17 Mar 2021
Cited by 17 | Viewed by 2945
Abstract
South China is one of the most densely populated and agriculture-based regions in China. Local spring precipitation is crucial to the people’s livelihood and social economic development. Using the observed and reanalysis datasets for the period 1958–2019, this study revealed an asymmetric effect [...] Read more.
South China is one of the most densely populated and agriculture-based regions in China. Local spring precipitation is crucial to the people’s livelihood and social economic development. Using the observed and reanalysis datasets for the period 1958–2019, this study revealed an asymmetric effect of El Niño—Southern Oscillation (ENSO) on the following spring precipitation over South China. During the years with positive ENSO phases, a strong positive correlation between spring precipitation and the preceding winter ENSO sea surface temperature (SST) anomalies existed over Guangdong province. For the years with negative ENSO phases, such a strong positive correlation shifts westwards to Guangxi province. To be specific, the El Niño events usually result in a precipitation surplus in the decaying spring over Guangdong province, while the La Niña events usually lead to a precipitation deficit in the decaying spring over Guangxi province. This is attributed to the nonlinear effects of ENSO on the atmospheric circulation. Compared with El Niño, the abnormal center of La Niña evidently extends westwards, inducing a westward movement of the anomalous low-level atmospheric circulation, which eventually results in a westward-shifted effect on the following spring precipitation over South China. Our findings emphasize the nonlinear responses of spring precipitation over South China to ENSO. This has important implications for the seasonal climate predictions over South China. Full article
(This article belongs to the Special Issue ENSO Prediction)
Show Figures

Figure 1

23 pages, 7249 KiB  
Article
Characterizing Bushfire Occurrences over Jamaica Using the MODIS C6 Fire Archive 2001–2019
by Candice S. Charlton, Tannecia S. Stephenson, Michael A. Taylor and Christina A. Douglas
Atmosphere 2021, 12(3), 390; https://doi.org/10.3390/atmos12030390 - 17 Mar 2021
Cited by 3 | Viewed by 2584
Abstract
There is an increasing need to develop bushfire monitoring and early warning systems for Jamaica and the Caribbean. However, there are few studies that examine fire variability for the region. In this study the MODIS C6 Fire Archive for 2001–2019 is used to [...] Read more.
There is an increasing need to develop bushfire monitoring and early warning systems for Jamaica and the Caribbean. However, there are few studies that examine fire variability for the region. In this study the MODIS C6 Fire Archive for 2001–2019 is used to characterize bushfire frequencies across Jamaica and to relate the variability to large-scale climate. Using additive mixed model and backward linear regression, the MODIS represents 80% and 73% of the local Jamaica Fire Brigade (JFB) data variability for 2010–2015, respectively. However, the MODIS values are smaller by a factor of approximately 30. The MODIS climatology over Jamaica reveals a primary peak in March and a secondary maximum in July, coinciding with months of minimum rainfall. A significant positive linear trend is observed for July-August bushfire events over 2001–2019 and represents 29% of the season’s variability. Trends in all-island totals in other seasons or annually were not statistically significant. However, positive annual trends in Zone 2 (eastern Jamaica) are statistically significant and may support an indication that a drying trend is evolving over the east. Significant 5-year and 3.5-year periodicities are also evident for April–June and September–November variability, respectively. Southern Jamaica and particularly the parish of Clarendon, known for its climatological dryness, show the greatest fire frequencies. The study provides evidence of linkages between fire occurrences over Jamaica and oceanic and atmospheric variability over the Atlantic and Pacific. For example, all-island totals show relatively strong association with the Atlantic Multidecadal Oscillation. The study suggests that development of an early warning system for bushfire frequency that includes climate indices is possible and shows strong potential for fire predictions. Full article
(This article belongs to the Special Issue Central America and Caribbean Hydrometeorology and Hydroclimate)
Show Figures

Figure 1

28 pages, 9789 KiB  
Review
Performance Analysis of Daily Global Solar Radiation Models in Peru by Regression Analysis
by Babak Mohammadi and Roozbeh Moazenzadeh
Atmosphere 2021, 12(3), 389; https://doi.org/10.3390/atmos12030389 - 17 Mar 2021
Cited by 20 | Viewed by 3735
Abstract
Solar radiation (Rs) is one of the main parameters controlling the energy balance at the Earth’s surface and plays a major role in evapotranspiration and plant growth, snow melting, and environmental studies. This work aimed at evaluating the performance of seven empirical models [...] Read more.
Solar radiation (Rs) is one of the main parameters controlling the energy balance at the Earth’s surface and plays a major role in evapotranspiration and plant growth, snow melting, and environmental studies. This work aimed at evaluating the performance of seven empirical models in estimating daily solar radiation over 1990–2004 (calibration) and 2004–2010 (validation) at 13 Peruvian meteorological stations. With the same variables used in empirical models (temperature) as well as two other parameters, namely precipitation and relative humidity, new models were developed by multiple linear regression analysis (proposed models). In calibration of empirical models with the same variables, the lowest estimation errors were 227.1 and 236.3 J·cm−2·day−1 at Tacna and Puno stations, and the highest errors were 3958.4 and 3005.7 at San Ramon and Junin stations, respectively. The poorest-performing empirical models greatly overestimated Rs at most stations. The best performance of a proposed model (in terms of percentage of error reduction) was 73% compared to the average of all empirical models and 93% relative to the poorest result of empirical models, both at San Ramon station. According to root mean square errors (RMSEs) of proposed models, the worst and the best results are achieved at San Martin station (RMSE = 508.8 J·cm−2·day−1) and Tacna station (RMSE = 223.2 J·cm−2·day−1), respectively. Full article
(This article belongs to the Special Issue Advances in Atmospheric Sciences)
Show Figures

Figure 1

17 pages, 6909 KiB  
Article
Potential Source Areas for Atmospheric Lead Reaching Ny-Ålesund from 2010 to 2018
by Andrea Bazzano, Stefano Bertinetti, Francisco Ardini, David Cappelletti and Marco Grotti
Atmosphere 2021, 12(3), 388; https://doi.org/10.3390/atmos12030388 - 17 Mar 2021
Cited by 6 | Viewed by 2836
Abstract
Lead content, enrichment factors, and isotopic composition (208Pb/206Pb and 207Pb/206Pb) measured in atmospheric particulate matter (PM10) samples collected for nine years at Ny-Ålesund (Svalbard islands, Norwegian Arctic) during spring and summer are presented and [...] Read more.
Lead content, enrichment factors, and isotopic composition (208Pb/206Pb and 207Pb/206Pb) measured in atmospheric particulate matter (PM10) samples collected for nine years at Ny-Ålesund (Svalbard islands, Norwegian Arctic) during spring and summer are presented and discussed. The possible source areas (PSA) for particulate inferred from Pb isotope ratio values were compared to cluster analysis of back-trajectories. Results show that anthropogenic Pb dominates over natural crustal Pb, with a recurring higher influence in spring, compared to summer. Crustal Pb accounted for 5–16% of the measured Pb concentration. Anthropogenic Pb was affected by (i) a Central Asian PSA with Pb isotope signature compatible with ores smelted in the Rudny Altai region, at the Russian and Kazakhstan border, which accounted for 85% of the anthropogenic Pb concentration, and (ii) a weaker North American PSA, contributing for the remaining 15%. Central Asian PSA exerted an influence on 71–86% of spring samples, without any significant interannual variation. On the contrary, 59–87% of summer samples were influenced by the North American PSA, with higher contributions during 2015 and 2018. Back-trajectory analysis agreed on the seasonal difference in PSA and highlighted a possible increased influence for North American air masses during summer 2010 and 2018, but not for summer 2015. Full article
(This article belongs to the Special Issue Air Pollution in the Polar Regions: Levels, Sources and Trends)
Show Figures

Graphical abstract

24 pages, 5734 KiB  
Article
Validation of WRF-Chem Model and CAMS Performance in Estimating Near-Surface Atmospheric CO2 Mixing Ratio in the Area of Saint Petersburg (Russia)
by Georgy Nerobelov, Yuri Timofeyev, Sergei Smyshlyaev, Stefani Foka, Ivan Mammarella and Yana Virolainen
Atmosphere 2021, 12(3), 387; https://doi.org/10.3390/atmos12030387 - 17 Mar 2021
Cited by 7 | Viewed by 4469
Abstract
Nowadays, different approaches for CO2 anthropogenic emission estimation are applied to control agreements on greenhouse gas reduction. Some methods are based on the inverse modelling of emissions using various measurements and the results of numerical chemistry transport models (CTMs). Since the accuracy [...] Read more.
Nowadays, different approaches for CO2 anthropogenic emission estimation are applied to control agreements on greenhouse gas reduction. Some methods are based on the inverse modelling of emissions using various measurements and the results of numerical chemistry transport models (CTMs). Since the accuracy and precision of CTMs largely determine errors in the approaches for emission estimation, it is crucial to validate the performance of such models through observations. In the current study, the near-surface CO2 mixing ratio simulated by the CTM Weather Research and Forecasting—Chemistry (WRF-Chem) at a high spatial resolution (3 km) using three different sets of CO2 fluxes (anthropogenic + biogenic fluxes, time-varying and constant anthropogenic emissions) and from Copernicus Atmosphere Monitoring Service (CAMS) datasets have been validated using in situ observations near the Saint Petersburg megacity (Russia) in March and April 2019. It was found that CAMS reanalysis data with a low spatial resolution (1.9° × 3.8°) can match the observations better than CAMS analysis data with a high resolution (0.15° × 0.15°). The CAMS analysis significantly overestimates the observed near-surface CO2 mixing ratio in Peterhof in March and April 2019 (by more than 10 ppm). The best match for the CAMS reanalysis and observations was observed in March, when the wind was predominantly opposite to the Saint Petersburg urbanized area. In contrast, the CAMS analysis fits the observed trend of the mixing ratio variation in April better than the reanalysis with the wind directions from the Saint Petersburg urban zone. Generally, the WRF-Chem predicts the observed temporal variations in the near-surface CO2 reasonably well (mean bias ≈ (−0.3) − (−0.9) ppm, RMSD ≈ 8.7 ppm, correlation coefficient ≈ 0.61 ± 0.04). The WRF-Chem data where anthropogenic and biogenic fluxes were used match the observations a bit better than the WRF-Chem data without biogenic fluxes. The diurnal time variation in the anthropogenic emissions influenced the WRF-Chem data insignificantly. However, in general, the data of all three WRF-Chem model runs give almost the same CO2 temporal variation in Peterhof in March and April 2019. This could be related to the late start of the growing season, which influences biogenic CO2 fluxes, inaccuracies in the estimation of the biogenic fluxes, and the simplified time variation pattern of the CO2 anthropogenic emissions. Full article
(This article belongs to the Special Issue Variations in Atmospheric Composition over Northern Eurasia Regions)
Show Figures

Figure 1

12 pages, 6596 KiB  
Article
Wintertime Cold Extremes in Northeast China and Their Linkage with Sea Ice in Barents-Kara Seas
by Yongyue Luo, Chun Li, Jian Shi, Xiadong An and Yaqing Sun
Atmosphere 2021, 12(3), 386; https://doi.org/10.3390/atmos12030386 - 16 Mar 2021
Cited by 5 | Viewed by 2870
Abstract
The impacts of Arctic sea ice on the interannual variability of winter extreme low temperature (WELT) in Northeast China (NEC) and the associated atmospheric circulation patterns are explored in this study based on meteorological observation and the National Centers for Environmental Prediction-National Center [...] Read more.
The impacts of Arctic sea ice on the interannual variability of winter extreme low temperature (WELT) in Northeast China (NEC) and the associated atmospheric circulation patterns are explored in this study based on meteorological observation and the National Centers for Environmental Prediction-National Center for Atmospheric Research (NCEP/NCAR) reanalysis data. Results show that WELT in NEC has prominent interannual variability. We further use ±0.8 standard deviation as the threshold to select the years of frequent and rare extreme low temperature anomalies. Using composite analysis, we find that there are significant negative geopotential height anomalies at 500 hPa over NEC and positive geopotential height anomalies along the Arctic region, which represent the intensification of the East Asian trough (EAT) and the negative Arctic Oscillation (AO) phase in the years of more frequent WELT. The opposite characteristics are detected in the years of rare WELT. Furthermore, we determine that the Barents-Kara Seas are key sea ice regions in Arctic area. In the years of frequent WELT, the decrease of autumn Barents-Kara Seas sea ice and the positive sea surface temperature anomaly can last until the following winter, which is conducive to the intensification of anticyclonic anomalies in Ural regions and the northward extension of Ural ridge (UR). The northerly flow in front of UR guides the cold air penetrating southward from polar regions. Moreover, the anomalous cyclone over East Asia deepens the EAT. The northerly wind behind EAT guides the cold air to the NEC region, causing the wintertime low temperature there. The almost opposite situation occurs in the years of rare WELT. Full article
(This article belongs to the Special Issue Temperature Extremes and Atmospheric Circulation)
Show Figures

Figure 1

17 pages, 538 KiB  
Article
Annual NO2 as a Predictor of Hourly NO2 Variability: Do Defra UK’s Heuristics Make Sense?
by Ashley Mills and Stephen Peckham
Atmosphere 2021, 12(3), 385; https://doi.org/10.3390/atmos12030385 - 16 Mar 2021
Viewed by 2199
Abstract
Background: In the UK an hourly objective exists for NO2 concentrations and assessment against this objective is required for various administrative purposes. The vast majority of NO2 measurement in the UK is non-hourly however. Thus, Defra guidance provides a heuristic to [...] Read more.
Background: In the UK an hourly objective exists for NO2 concentrations and assessment against this objective is required for various administrative purposes. The vast majority of NO2 measurement in the UK is non-hourly however. Thus, Defra guidance provides a heuristic to estimate hourly objective exceedance likelihood from an annual average. Methods: We examine the performance of this heuristic using a Europe wide dataset containing over 20,000 site-years of data, and perform a sensitivity test to account for data uncertainty. Results: The heuristic misses 64% of sites that break the hourly objective. The heuristic is neither a necessary nor sufficient condition for predicting hourly objective breaches. The sensitivity test reveals that the heuristic is input-fragile. Conclusions: The heuristic performs poorly, is weakly coupled to medical evidence, and work is needed to develop new short term exposure limits for NO2. Full article
(This article belongs to the Section Air Quality and Health)
Show Figures

Figure 1

25 pages, 12518 KiB  
Article
GIS-Based Approach to Spatio-Temporal Interpolation of Atmospheric CO2 Concentrations in Limited Monitoring Dataset
by Yaroslav Bezyk, Izabela Sówka, Maciej Górka and Jan Blachowski
Atmosphere 2021, 12(3), 384; https://doi.org/10.3390/atmos12030384 - 15 Mar 2021
Cited by 17 | Viewed by 6240
Abstract
Understanding the magnitude and distribution of the mixes of the near-ground carbon dioxide (CO2) components spatially (related to the surface characteristics) and temporally (over seasonal timescales) is critical to evaluating present and future climate impacts. Thus, the application of in situ [...] Read more.
Understanding the magnitude and distribution of the mixes of the near-ground carbon dioxide (CO2) components spatially (related to the surface characteristics) and temporally (over seasonal timescales) is critical to evaluating present and future climate impacts. Thus, the application of in situ measurement approaches, combined with the spatial interpolation methods, will help to explore variations in source contribution to the total CO2 mixing ratios in the urban atmosphere. This study presents the spatial characteristic and temporal trend of atmospheric CO2 levels observed within the city of Wroclaw, Poland for the July 2017–August 2018 period. The seasonal variability of atmospheric CO2 around the city was directly measured at the selected sites using flask sampling with a Picarro G2201-I Cavity Ring-Down Spectroscopy (CRDS) technique. The current work aimed at determining the accuracy of the interpolation techniques and adjusting the interpolation parameters for estimating the magnitude of CO2 time series/seasonal variability in terms of limited observations during the vegetation and non-vegetation periods. The objective was to evaluate how different interpolation methods will affect the assessment of air pollutant levels in the urban environment and identify the optimal sampling strategy. The study discusses the schemes for optimization of the interpolation results that may be adopted in areas where no observations are available, which is based on the kriging error predictions for an appropriate spatial density of measurement locations. Finally, the interpolation results were extended regarding the average prediction bias by exploring additional experimental configurations and introducing the limitation of the future sampling strategy on the seasonal representation of the CO2 levels in the urban area. Full article
Show Figures

Figure 1

Previous Issue
Next Issue
Back to TopTop